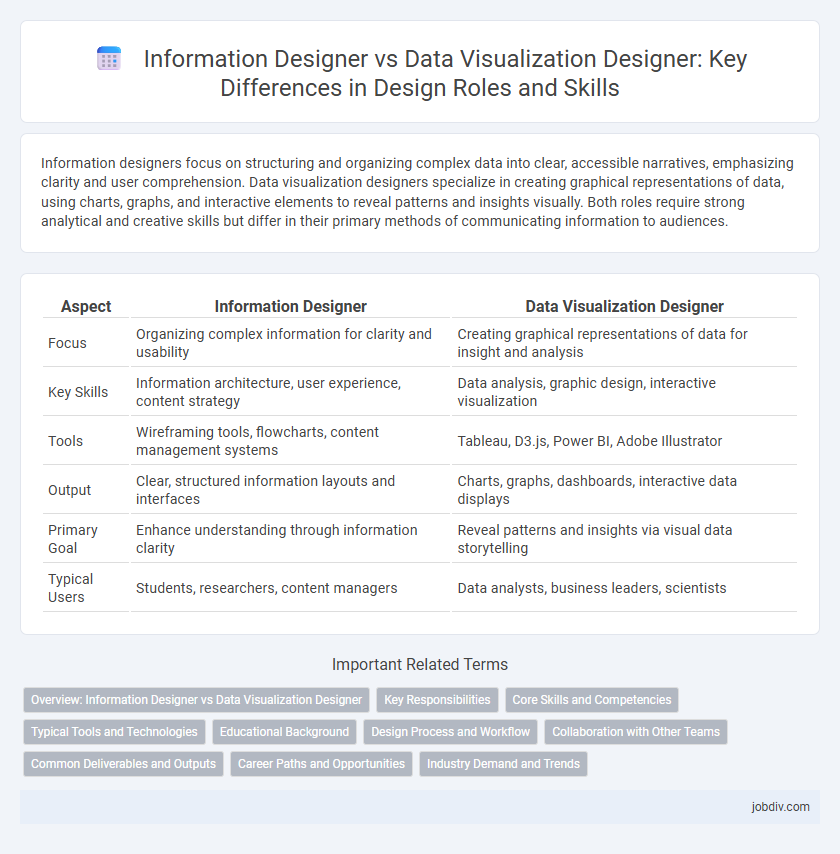
Information designers focus on structuring and organizing complex data into clear, accessible narratives, emphasizing clarity and user comprehension. Data visualization designers specialize in creating graphical representations of data, using charts, graphs, and interactive elements to reveal patterns and insights visually. Both roles require strong analytical and creative skills but differ in their primary methods of communicating information to audiences.
Table of Comparison
| Aspect | Information Designer | Data Visualization Designer |
|---|---|---|
| Focus | Organizing complex information for clarity and usability | Creating graphical representations of data for insight and analysis |
| Key Skills | Information architecture, user experience, content strategy | Data analysis, graphic design, interactive visualization |
| Tools | Wireframing tools, flowcharts, content management systems | Tableau, D3.js, Power BI, Adobe Illustrator |
| Output | Clear, structured information layouts and interfaces | Charts, graphs, dashboards, interactive data displays |
| Primary Goal | Enhance understanding through information clarity | Reveal patterns and insights via visual data storytelling |
| Typical Users | Students, researchers, content managers | Data analysts, business leaders, scientists |
Overview: Information Designer vs Data Visualization Designer
Information Designers focus on organizing complex data into clear, accessible narratives that enhance understanding through structured content and user-centric design principles. Data Visualization Designers specialize in creating graphical representations like charts, maps, and infographics to reveal patterns, trends, and insights from raw datasets. Both roles require expertise in design thinking and data literacy, but they differ in their emphasis on qualitative storytelling versus quantitative graphical display.
Key Responsibilities
Information Designers focus on structuring and organizing content to enhance comprehension and usability across various media, emphasizing clarity and user experience. Data Visualization Designers specialize in translating complex datasets into intuitive visual formats like charts, graphs, and interactive dashboards to facilitate data-driven decision making. While both roles require strong design and analytical skills, Information Designers prioritize content hierarchy and communication, whereas Data Visualization Designers concentrate on statistical representation and visual analytics.
Core Skills and Competencies
Information Designers excel in organizing complex content, employing user-centered research, and creating clear, concise communication through typography and layout. Data Visualization Designers specialize in transforming large datasets into interactive, visually compelling graphics using tools like Tableau, D3.js, and advanced statistical analysis. Both roles require strong analytic thinking and design principles, but Information Designers prioritize narrative clarity while Data Visualization Designers emphasize data accuracy and insight discovery.
Typical Tools and Technologies
Information Designers typically use tools like Adobe Illustrator, Sketch, and Axure RP to create structured layouts and user-friendly interfaces that emphasize clarity and hierarchy. Data Visualization Designers rely heavily on technologies such as Tableau, Power BI, D3.js, and Python libraries like Matplotlib and Seaborn to transform complex datasets into interactive and dynamic visual representations. Both roles utilize prototyping tools like Figma and collaborative platforms such as Miro, but their core software reflects their distinct focus on either informational clarity or data-driven storytelling.
Educational Background
Information designers typically possess degrees in graphic design, communication, or information science, emphasizing skills in organizing and presenting complex information clearly and effectively. Data visualization designers often have backgrounds in data science, computer science, or statistics, focusing on transforming raw data into interactive and insightful visual formats. Both fields benefit from interdisciplinary knowledge, but the educational paths highlight distinct expertise in design principles versus data analysis.
Design Process and Workflow
Information Designers focus on structuring and organizing complex data into clear, intuitive formats that prioritize user comprehension, employing techniques such as content analysis and user research in their design process. Data Visualization Designers emphasize the creation of visual representations like charts, graphs, and interactive dashboards, using tools and algorithms to translate raw data into visually engaging and actionable insights. Their workflows differ as Information Designers often start with narrative development and data categorization, while Data Visualization Designers iterate on visual encoding and interactivity to enhance data interpretation.
Collaboration with Other Teams
Information designers collaborate closely with content strategists and UX designers to create cohesive narratives that enhance user comprehension and engagement. Data visualization designers work alongside data scientists and software engineers to transform complex datasets into interactive, visually compelling graphics that support data-driven decisions. Both roles require seamless communication across teams to ensure accuracy, clarity, and aesthetic alignment in delivering effective design solutions.
Common Deliverables and Outputs
Information Designers and Data Visualization Designers both create visual representations to communicate complex information effectively, often delivering infographics, dashboards, and interactive reports. Information Designers prioritize clarity and usability in organizing textual and graphical content, producing wireframes, user flows, and information architecture diagrams. Data Visualization Designers specialize in translating datasets into graphical formats such as charts, heatmaps, and network graphs, emphasizing data accuracy and visual aesthetics.
Career Paths and Opportunities
Information Designers specialize in structuring and presenting complex data into clear, accessible formats, focusing on user experience and communication strategies across digital and print media. Data Visualization Designers emphasize creating interactive graphics and visual representations using tools like Tableau, D3.js, or Power BI to facilitate data-driven decision-making in tech, finance, and healthcare industries. Career opportunities for Information Designers often involve roles in UX/UI design, content strategy, and instructional design, while Data Visualization Designers find growth in data science, business intelligence, and analytics-driven enterprises.
Industry Demand and Trends
Information Designers focus on structuring and presenting complex data through clear, user-centered content strategies, while Data Visualization Designers emphasize interactive graphics and tools to reveal insights from large datasets. The industry demand for Data Visualization Designers is rapidly growing due to the surge in big data and AI-driven analytics, with roles often requiring proficiency in programming and statistical analysis. Information Designers remain essential in sectors like publishing and education, where clarity and accessibility of information drive user engagement and decision-making.
Information Designer vs Data Visualization Designer Infographic