Information designers create structured content frameworks that prioritize clarity and user engagement, ensuring data is meaningful and accessible. Information visualizers focus on transforming complex datasets into visually compelling graphics that aid quick comprehension. Both roles complement each other by blending analytical insight with artistic representation to enhance communication.
Table of Comparison
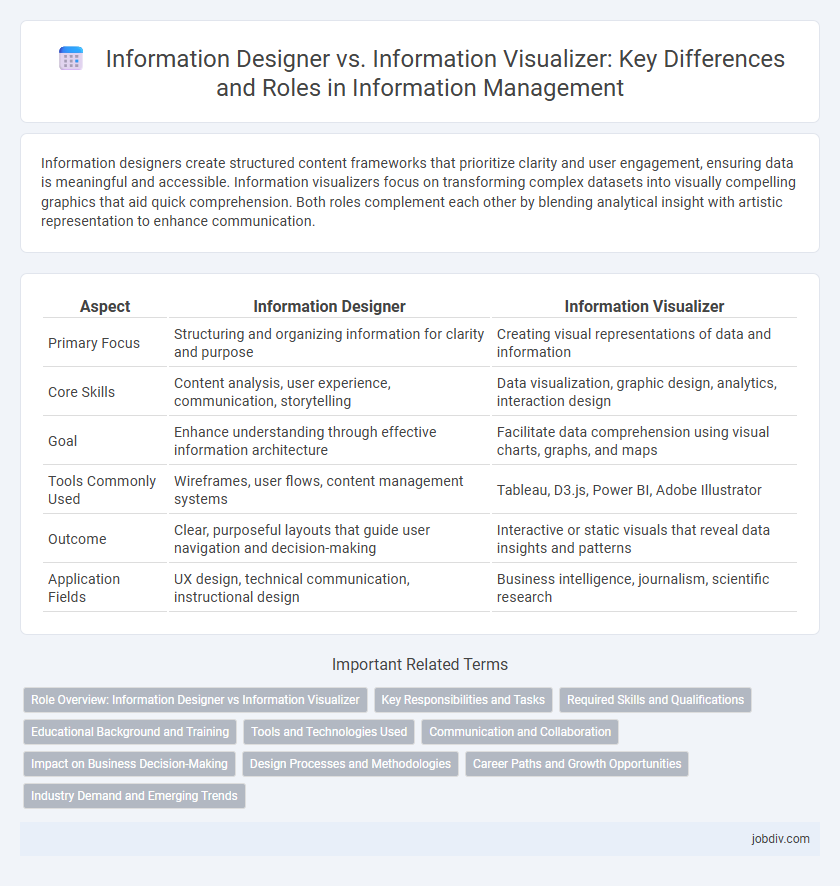
| Aspect | Information Designer | Information Visualizer |
|---|---|---|
| Primary Focus | Structuring and organizing information for clarity and purpose | Creating visual representations of data and information |
| Core Skills | Content analysis, user experience, communication, storytelling | Data visualization, graphic design, analytics, interaction design |
| Goal | Enhance understanding through effective information architecture | Facilitate data comprehension using visual charts, graphs, and maps |
| Tools Commonly Used | Wireframes, user flows, content management systems | Tableau, D3.js, Power BI, Adobe Illustrator |
| Outcome | Clear, purposeful layouts that guide user navigation and decision-making | Interactive or static visuals that reveal data insights and patterns |
| Application Fields | UX design, technical communication, instructional design | Business intelligence, journalism, scientific research |
Role Overview: Information Designer vs Information Visualizer
Information Designers focus on structuring and organizing complex data into clear, meaningful narratives that enhance user comprehension and decision-making. Information Visualizers specialize in transforming data into dynamic, interactive visual formats, prioritizing aesthetics and user engagement to facilitate data interpretation. Both roles require expertise in data analysis and communication but differ in their emphasis on content hierarchy versus visual storytelling.
Key Responsibilities and Tasks
Information Designers focus on structuring and organizing data to create clear, user-friendly content tailored to enhance communication and comprehension. Information Visualizers transform complex information into visual formats such as infographics, charts, and maps to facilitate quick understanding and decision-making. Both roles require expertise in data analysis, audience research, and the application of design principles to ensure effective information delivery.
Required Skills and Qualifications
An Information Designer requires strong skills in user experience design, typography, and data interpretation to create clear, effective communication materials, often holding degrees in graphic design, communication, or information design fields. An Information Visualizer specializes in data visualization techniques, proficiency in software like Tableau, D3.js, and Python, and a background in data science, statistics, or computer science to transform complex datasets into intuitive visual formats. Both roles demand attention to detail, creativity, and analytical thinking, but the Information Designer focuses more on narrative clarity while the Information Visualizer emphasizes technical data representation.
Educational Background and Training
Information Designers typically hold degrees in graphic design, communication, or information science, emphasizing coursework in visual communication and user experience. Information Visualizers often have backgrounds in data science, computer graphics, or cognitive psychology, with specialized training in data analysis, visualization software, and human-computer interaction. Both roles require proficiency in design principles and an understanding of how to convey complex information clearly, but Information Visualizers generally need deeper technical expertise in data handling.
Tools and Technologies Used
Information Designers primarily use design software such as Adobe Creative Suite and Sketch to create structured layouts and user-centric designs that communicate complex data effectively. Information Visualizers leverage advanced data visualization tools like Tableau, Power BI, and D3.js to transform large datasets into interactive charts, graphs, and dashboards. Both roles increasingly incorporate coding languages such as HTML, CSS, and JavaScript to enhance interactivity and customize visual presentations for diverse platforms.
Communication and Collaboration
Information Designers specialize in structuring and presenting complex data to enhance clarity and user engagement, emphasizing clear communication strategies tailored to target audiences. Information Visualizers focus on creating graphical representations that simplify data interpretation, requiring strong collaboration with data scientists and stakeholders to ensure accuracy and relevance. Effective teamwork between these roles improves the overall communication process, enabling seamless transformation of raw data into actionable insights.
Impact on Business Decision-Making
Information Designers structure and organize data to enhance clarity, enabling businesses to interpret complex information efficiently and make informed strategic decisions. Information Visualizers create compelling graphical representations of data, helping stakeholders quickly grasp trends and insights that drive timely and effective decision-making. Both roles enhance business outcomes by transforming raw data into actionable intelligence, reducing ambiguity and accelerating the decision process.
Design Processes and Methodologies
Information Designers focus on creating structured frameworks that prioritize clarity, usability, and audience comprehension through user-centered research and iterative design methodologies. Information Visualizers emphasize transforming complex data sets into compelling visual formats using advanced visualization tools, data analysis techniques, and storytelling principles. Both roles integrate human-centered design processes but differ in their approach, with designers focusing on content organization and visualizers on dynamic data representation.
Career Paths and Growth Opportunities
Information Designers specialize in structuring and organizing data to enhance clarity and user comprehension, often advancing into roles like UX design or content strategy. Information Visualizers focus on creating interactive and graphical representations of complex data, with career growth leading toward data science, visualization consultancy, or advanced analytics. Both paths offer opportunities in tech, marketing, and education sectors, driven by increasing demand for data-driven decision making and communication.
Industry Demand and Emerging Trends
Information Designers are in high demand for their expertise in structuring complex data into clear, user-centric interfaces, particularly in sectors like healthcare, finance, and education where clarity and usability drive decision-making. Information Visualizers are gaining traction with the rise of big data and AI, specializing in creating dynamic, interactive visual representations that enhance data comprehension across industries such as marketing, technology, and scientific research. Emerging trends emphasize interdisciplinary skills, combining data analytics, UX design, and advanced visualization tools, reflecting a strong industry shift towards integrative digital communication strategies.
Information Designer vs Information Visualizer Infographic